Clustering: how are jobs distributed in PA in 2019?
Only Jobs data
We use clustering analysis to find out the patterns of jobs distribution in different block groups.
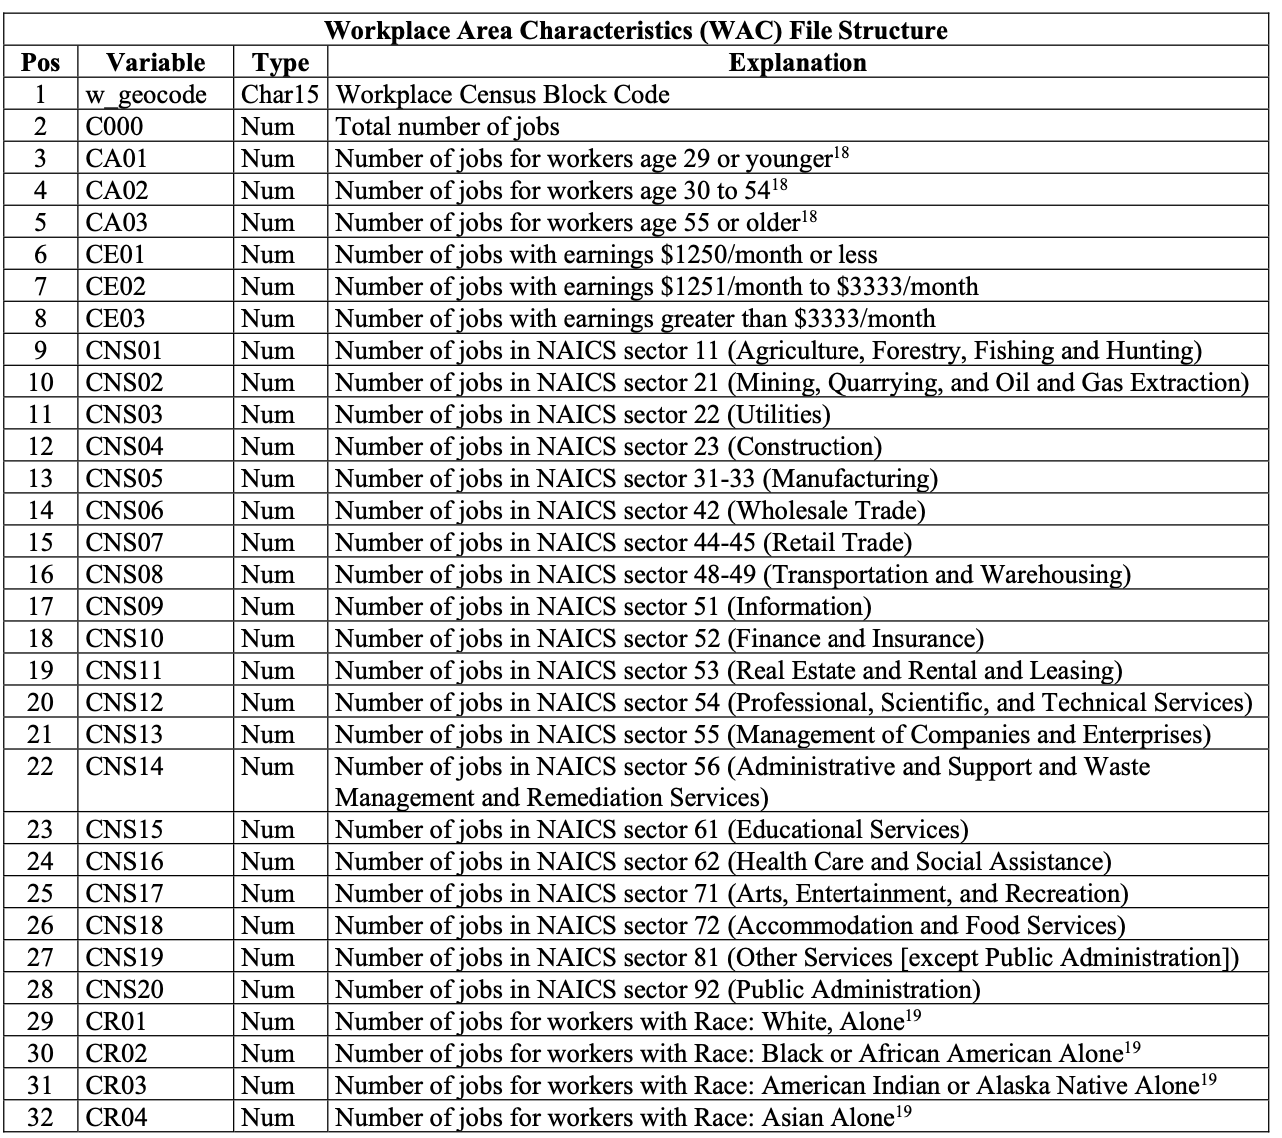
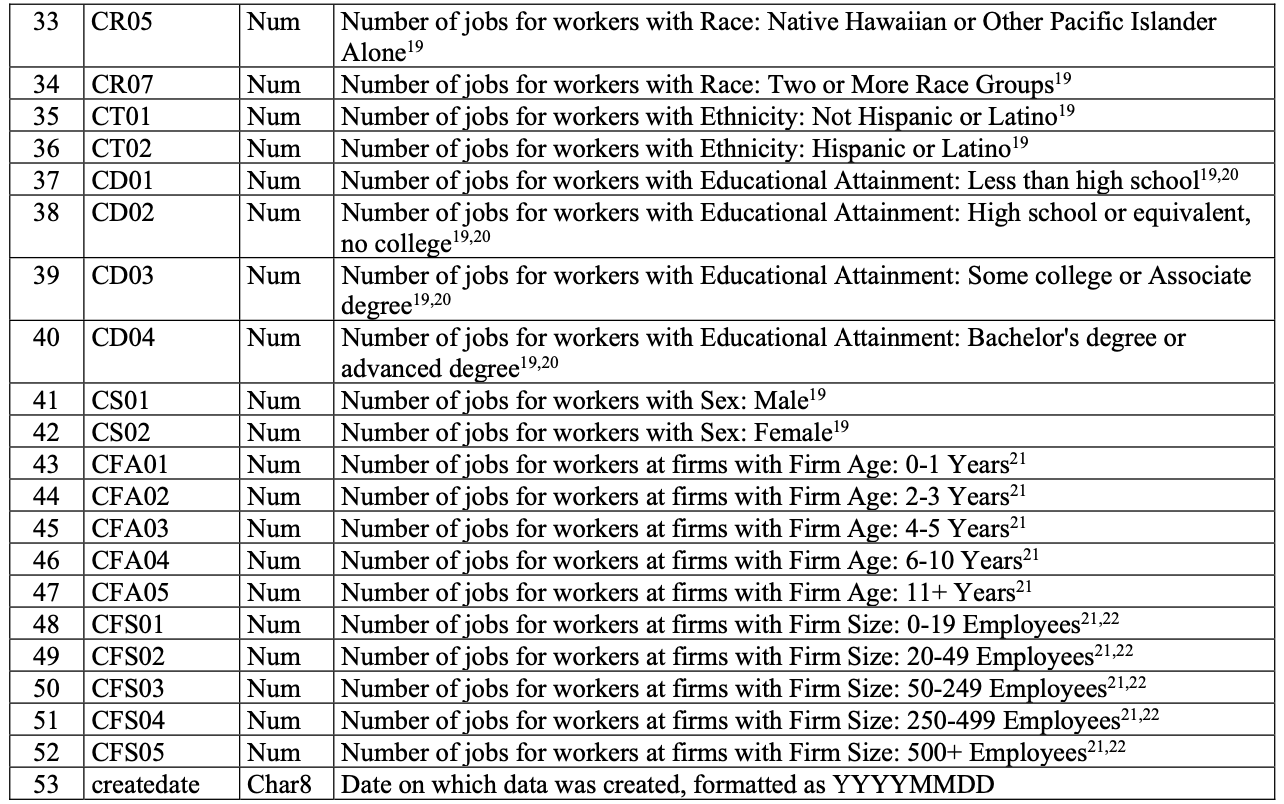
The dataset we used is WAC(Workplace Area Characteristic data, jobs are totaled by work Census Block), a subset of LEHD dataset. In the dataset, every row is the numbers of employees in a block group in a year, and the employees are classified in different dimension.
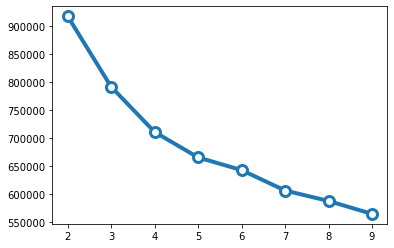
4 Clusters
We use elbow method and determine 4 clusters in the dataset.
Below are the overall interactive charts. You can select the factor you are interested in to see how different group differentiate. Note that barplot of the type of job is seperated from the main chart because of space limitation.
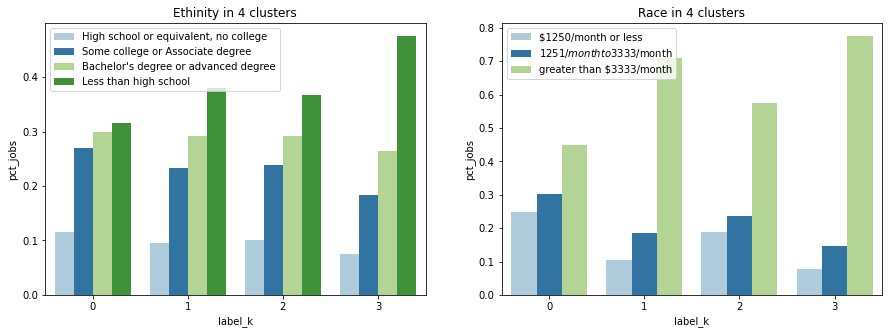
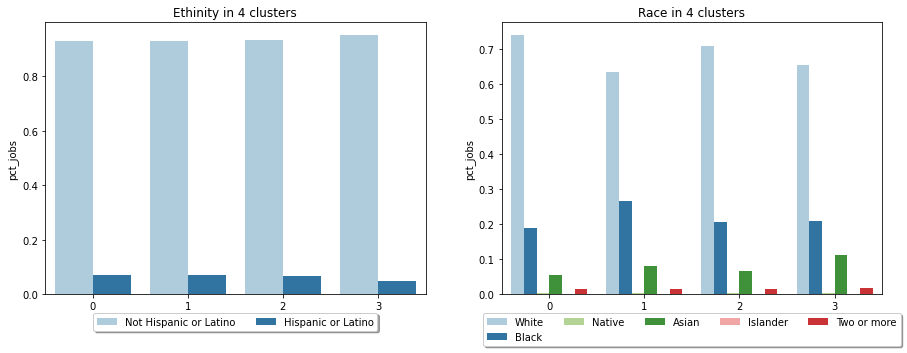
Overall factors of 4 clusters:
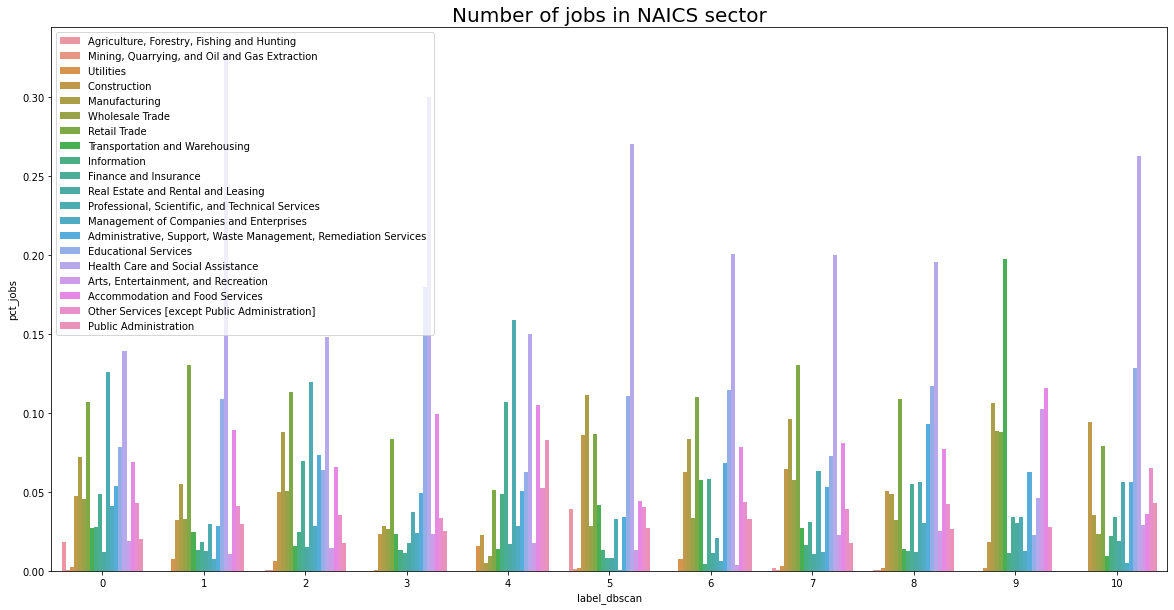
Job types of 4 clusters:
Why k-means?
We also tried DBSCAN to do clustering, but compared to K-means, the result of DBSCAN is more complicated. It often defines excessive clusters and doesn’t show difference among them. For example, below is a barplot of jobs type in different clusters, which provides little information.